Data is termed the ‘new oil’ as it fuels digital innovation, aids in decision-making, and transforms business workflows. The raw data must be transformed into useful insights to be effective. This is when data analytics tools come in handy.
In 2025, open-source data analytics tools like Apache Superset, Metabase, KNIME, etc., are used by organizations and individuals to convert raw data into meaningful insights. As per Fortune Business Insights, the big data analytics market size in 2023 was $307.52 billion and $348.21 billion in 2024, globally. By 2032, the market value is estimated to grow to $961.89 billion, with a CAGR of 13.5% during this timeline.

In this blog, we will be discussing the top data analytics platforms, their categories and key features, and how to select one to suit your needs the best.
How to Select the Best Open-Source Analytics Tools?
To select the right tool or a combination of tools, you need to keep the following factors in mind.
- Skill
Carefully analyze your team’s knowledge base, as some data analysis tools might require more technical skills than others. To ensure quick and efficient adoption, make sure your teams’ knowledge and the tool’s requirements are on the same page.
- Applications & Goals
Understand your aims and needs. What do you need the analytics tool to achieve? Some might need it to build creative dashboards, while others might require it to execute statistical analysis, develop complicated data pipelines, or deploy ML models.
- Cost
Though the tools are open-source, there are related costs of maintenance, hosting, exclusive features, add-ons, and others. Keep these in mind before calculating potential costs.
- Data Sources
Figure out the type of data sources that you need to connect to, like APIs, cloud storage, databases, etc. Select a tool that can integrate with the data source perfectly.
- Scalability
If you are planning for future growth, then select an appropriate tool that can scale with you. Calculate the amount of the latest data and how its volume can fluctuate in the future.
Top Open-Source Data Analytics Tools in 2025
1. KNIME Analytics Platform

Category: Data Science & Analytics
Open-source or Paid: Open-source (GPLv3 License), paid extensions, and support.
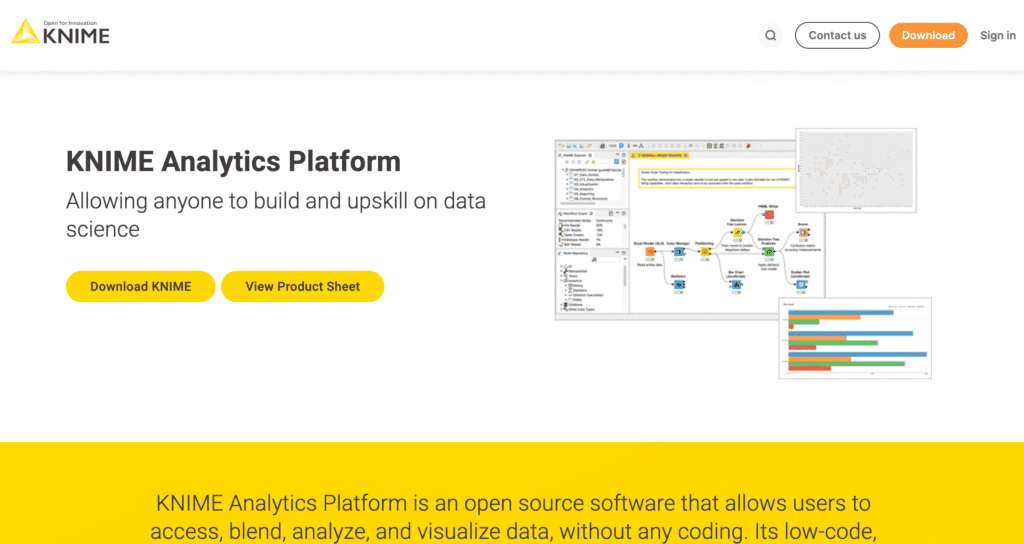
KNIME is an open-source all-in-one data analysis platform that covers every aspect of the data analysis workflow. You can use it for data ingestion, preprocessing, modelling, visualization, and deployment. KNIME offers a visual workflow interface that is suitable for both high-level data scientists and beginners, without the need for any complex coding.
In 2024, KNIME launched its AI companion, K-AI, with which its users can develop AI-driven data workflows. This innovative data automation with AI allows users to reduce time to insight while maintaining complete transparency and control.
Innovative Features of the KNIME Analytics Platform:
- Without the need for complex coding, users can drag-and-drop nodes to create visuals.
- This analytics tool offers over 4000 nodes to choose from for text processing, machine learning, data processing, and others.
- You can easily customize by integrating Python, R, and Java.
- A huge selection of community-contributed workflows and nodes is available.
- Beginners can take advantage of the automated machine learning (AutoML) capabilities.
2. R (with Tidyverse)
Category: Data Analysis & Statistical Computing
Open-source or Paid: Open-source (GNU GPL License)
R with Tidyverse is a very popular statistical programming language for data analysis and visualization. It is also a comprehensive package of data analytics tools that cover the entire data science workflow, including data manipulation, data analysis, and visualization. The packages offered are huge and can be used for various analytical requirements – from beginner-level statistics to advanced ML.
Innovative Features of R with Tidyverse:
- Offers a complete range of statistical functions and models, like time series analysis, linear regression, hypothesis testing, and others.
- By using ggplot2, a core Tidyverse package, users can create publication-quality graphs and plots.
- Using the dplyr, tidyr, etc. Tidyverse packages, users can efficiently convert and wrangle data.
- You can combine text, code, and visualizations in one document for duplicable reporting using R Markdown.
3. Python (with Pandas, NumPy, SciPy)

Category: Data Science & Machine Learning
Open-source or Paid: Open-source (Python Software Foundation License)
Python’s foundation offers three core libraries, Pandas, NumPy, and SciPy, to analyze and manipulate data efficiently. Python is a highly popular programming language that is widely used in the data science community. With it, users can get access to an enriched ecosystem of frameworks and libraries that can be used for data analysis, visualization, and manipulation.
Innovative Features of Python (with Pandas, NumPy, SciPy):
- Panda offers high-performance, user-friendly data structures for data analysis and manipulation. Users can read and write data in different formats, merge and join datasets, and also handle missing data.
- With NumPy, users can access a variety of mathematical functions for array operations.
- SciPy can be built on NumPy to get access to extra functionalities for technical and scientific computing, like optimization, integration, linear algebra, and signal processing.
4. Apache Superset
Category: Data Exploration & Visualization
Open-source or Paid: Open-source (Apache 2.0 License)
It is an open-source data exploration and visualization platform that can handle petabyte-scale data (big data). Apache Superset is a highly customizable platform designed to integrate with various teams and replace established business intelligence tools. It can be easily accessible to both technical and non-technical users.
Innovative Features of Apache Superset:
- You can access a wide variety of visualizations, such as bar charts, line charts, scatter plots, maps, and heatmaps, in its library.
- You can create interactive dashboards with filters and drag-and-drop components.
- SQL editor for data exploration and ad-hoc queries.
- You can connect to a variety of data sources and databases, like cloud storage, NoSQL databases, SQL databases, and others.
- An ultra-light semantic layer regulates data source presentation to end users and allows for the definition of custom metrics and dimensions.
5. Metabase
Category: Business Intelligence
Open-source or Paid: Open-source (AGPLv3 License) with cloud-hosted option (paid)
With the Metabase open-source tool, users can conduct data querying, visualization, and instrumentation. This business intelligence tool is designed to effectively and intuitively answer user questions on data. Metabase is developed for both technical and non-technical users, and you do not need any SQL knowledge. This is an ideal BI tool for users who want to create simple visualizations.
Innovative Features of Metabase:
- Metabase has a user-based interface, i.e., you can ask questions in plain English and you will receive replies in the form of charts, graphs, etc.
- It has an instinctive query builder that users can use to develop complicated queries without writing any SQL code.
- You can build interactive dashboards to examine key metrics and pass them on to your team.
- A wide variety of chart types is available for you to create customized charts.
- Its embedded analytics feature allows you to embed charts and dashboards into applications or websites.
6. Orange Data Mining

Category: Data Mining & Machine Learning
Open-source or Paid: Open-source (GPLv3 License)
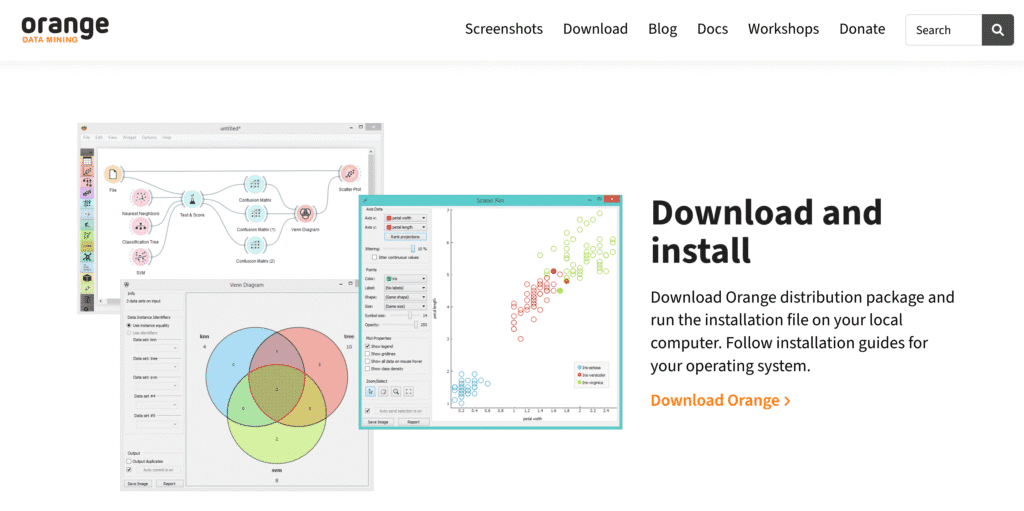
It is an open-source platform for data mining, data visualization, and machine learning that is highly versatile. Orange does not require any extensive coding. Users can create data analysis workflows by quickly dragging, dropping, and connecting widgets using its visual programming interface. Users, like domain experts and non-techs, can easily utilize the power of machine learning without having technical expertise.
Innovative Features of Orange Data Mining:
- It has comprehensive functionality and comes loaded with a variety of preprocessing, machine learning, and data visualization algorithms.
- It can also be used by expert programmers as a Python library.
- Orange promotes community development and collaboration through GitHub.
- It offers a wide array of interactive visualizations, like decision trees, heat maps, scatter plots, and many more.
- Due to its intuitive interface, Orange Data Mining is also popularly used in education scenarios, as it simplifies teaching/ learning data mining and ML.
7. Apache Airflow
Category: Data Pipeline Orchestration & Workflow Management
Open-source or Paid: Open-source (Apache 2.0 License)
It is an open-source workflow management platform that allows you to systematically author, schedule, and monitor workflows. You can define workflows as acyclic graphs (DAGs) of tasks. In which each task is a representation of a work unit, e.g., data extraction, data transformation, and loading into the database. Apache Airflow’s vital architectural components are the scheduler, executor, web server (UI), and metadata database.
Innovative Features of Apache Airflow:
- The workflows are defined using Python code, making them customizable and expandable.
- Users can schedule workflows to operate at specified intervals or depending on triggers.
- You can use its intuitive web interface to visualize and manage workflows.
- End-to-end monitoring allows you to check workflow progression and detect failures from alerts.
- Highly scalable and can handle a huge amount of data.
8. MLflow
Category: Machine Learning Lifecycle Management
Open-source or Paid: Open-source (Apache 2.0 License)
Developed by Databricks, MLflow is an open-source platform that manages the end-to-end ML lifecycle, including experimentation, reproducibility, and deployment. It can work with any type of programming language or ML library. Thus, it is widely used by data scientists and machine learning engineers to collaborate and develop their projects. The core components of MFflow are:
- MLflow Tracking
- MLflow Projects
- MLflow Models
- MLflow Model Registry
Innovative Features of MLflow:
- You can track the entire experiment to reproduce and compare, like metrics, artifacts (model files), log parameters, etc.
- It has a user-friendly interface that you can use for comparing runs, visualizing experiments, and managing models.
- It offers a centralized model store to manage model stages and transitions.
- This platform is compatible with widely used ML libraries, like TensorFlow, PyTorch, etc.
- It is vendor-neutral and can be run on various environments, like local machines, on-prem clusters, cloud platforms like Databricks, Azure, etc.
Big data analytics platforms are a need for modern, data-dependent organizations. These open-source platforms promote scalability within organizations. Users can take advantage of its community aspect, where expert programmers and beginners come together to add to the software’s continuous enhancement. Using open-source analytics tools can also significantly cut down on licensing fees and other associated costs, making it a cost-effective option for small to large-scale organizations.
In addition to the above-mentioned ones, there are several other platforms, like Apache Kafka, OpenSearch, etc., that you can utilize to analyze data and get insights on how to gain a competitive edge.


