


Software as a Service (SaaS) is a business model based on cloud computing, which means it all runs on the internet, which in turn means a lump of data. And everything is trackable, but it does not mean it is required to do so. To optimize your SaaS business, you must understand what to measure. A well-informed and decisive evaluation of metrics helps you cut out the junk and focus on metrics and KPIs that truly matter. In this blog, you will discover how to identify different metrics and what the most crucial SaaS key metrics are.
What are SaaS Metrics?
They are numbers and figures that help a SaaS company understand how well it is performing. As it runs on the cloud, every step creates ample data about the users, product usage, and revenues. These metrics are the outcome of all these steps and help answer some important questions for the SaaS business owners.
Information such as how many customers they have, the number of new signups, customer retention, what the monthly revenue is, and the number of happy customers.
In a nutshell, SaaS metrics are useful insights and evaluations that help businesses make better decisions and take required actions to grow and improve their product/services.
Types of SaaS Key Metrics
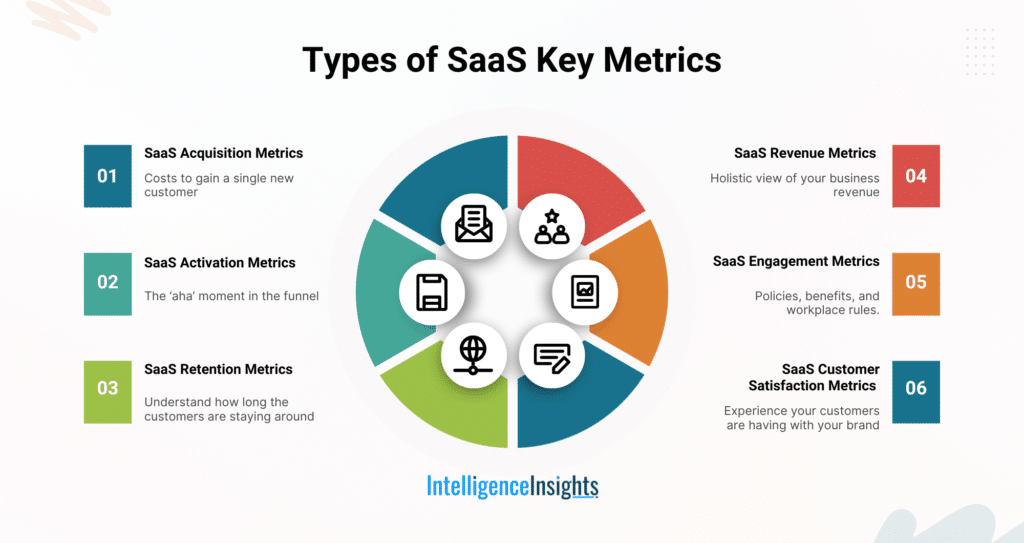
There are different types of indicators encompassing the marketing, sales, finance, and customer service criteria to measure the success of your SaaS company. Let’s look at each one in detail:
SaaS Acquisition Metrics
These are indicators of how well capable a business is in acquiring new customers. They speak of the company’s acquisition efforts and ability to increase revenues while increasing the consumer base.
1. Customer Acquisition Cost (CAC)
It defines how much it costs you to gain a single new customer. It is the most optimal and fastest way to understand whether your marketing efforts are efficient or leading to a burnout of cash. Your CAC must always be less than retention and conversion rates for a profitable business.
You can calculate CAC by:
CAC = Total acquisition costs within a specific period of time / Number of new customers acquired
2. Leads
These are special opportunities for sales teams; these are people who have shown interest by filling out forms or requesting a demonstration, but haven’t yet converted. Strong leads improve conversion rate.
3. Conversions
Also known as lead-to-customer or lead-to-account rate, it is a measure of leads converting into paying customers. You can calculate this by dividing the number of paying customers by the number of generated leads.
It is a conjunction between marketing and sales. For instance, if high-quality leads are being generated, it shows the effectiveness of marketing teams. But if they are not being converted into paying customers, there is a shortfall from the sales teams.
4. Traffic & Signups
Traffic is the number of visitors on your website or landing page; it indicates top-funnel reach. And signups are the number of people who created an account on your website and explored it, which could be an entry into the product funnel.
SaaS Activation Metrics
Often known as the ‘aha’ moment in the funnel, it is when everything feels right to the user. They realise the importance and core value of your product, which can be the best-suited solution for their problems.
1. Activation Rate
It is the number of users who completed key steps that deliver your product’s core values. Activation Rate can be anything, such as sending an email campaign, integration of your tool with another platform, or anything else. It matters because if they don’t reach activation, they are likely to churn.
2. Time to First Value (TTFV)
It is the time taken by a user to reach or hit the ‘aha!’ moment after signing up. It matters because SaaS is about speed, and the quicker your product value is identified by the user, the better the chances of activation and retention.
Longer TTFV can result in higher drop-off rates even before users find your product useful.
3. Onboarding Completion Rate
It is the percentage of users completing the onboarding actions, including setup, profile creation, or tutorials. A strong onboarding process rate is important for users to see the value of your product. Low completion rates can indicate friction in user experience.
SaaS Retention Metrics
These metrics help you understand how long the customers are staying around. That is how many users are continuing to use your services. They help in identifying long-term value.
1. Churn Rate
Also known as customer churn rate, it is a measure of the loss of customers. It shows the percentage of total customers who discontinued the use of your service or product during a given period of time.
A high customer churn rate has a negative impact on your business. And it can help identify the issues with the customer experience.
2. Customer Retention Rate
It is the opposite of churn rate, and it shows how many customers continue to use your product and services over a period of time. It gives an idea of how well your strategy is working.
3. Logo Retention
It is one of the metrics that help you understand the base stability of your business. It is about the number of customers who stick around, no matter the revenue they generate. Logo Retention is more about customer count rather than revenue value.
4. DAU/WAU/MAU
These metrics stand for the daily, weekly, and monthly rate of active users, that is, how many users interact with your product or service. They also indicate the app stickiness by calculating the ratio of daily and monthly usage.
SaaS Revenue Metrics
These metrics offer you a holistic view of your business revenue and what are the contributing factors, and what needs to be changed for better revenues.
1. Monthly Recurring Revenue (MRR)
It is arguably the most crucial metric in calculating revenues. MRR is the money obtained from subscriptions per month, and it is important for tracking short-term financial performance. It helps you see your growth consistency.
2. Annual Recurring Revenue (ARR)
It is the same as MRR, but the timeframe is a year. This calculation is done on the basis of the yearly average, which is important for long-term stability. It is also known as Annualized Run Rate or Subscription Revenue.
3. Annual Contract Value (ACV)
It measures the average revenue generated by a customer in a year. It is of major use in B2B SaaS companies to understand the deals and sales efficiency. Better ACV shows enterprise-level customers means people taking your services for a longer period of time.
4. Average Revenue Per Account (ARPA, ARPU, or ARPC)
It contributes to the amount of money a single customer spends on a company. It is a great way of understanding how customers are dealing with your services and products. And what adjustments do you need in your pricing models and CAC?
High ARPU increases overall profitability.
5. Customer Lifetime Value (LTV)
It is the estimation of the total expected value from a customer over the period of their relationship with the company. LTV is a crucial metric as it helps to gain long-term insights into the value a customer can offer and what the most profitable customer segments are.
It is typically calculated by multiplying the value generated per customer by the length of their lifespan as a customer.
6. Net Revenue Retention (NRR)
This metric is also known as dollar retention, and it is the percentage of revenue retained from the existing customers over a course of time. High NRR is a sign of good and a key metric of SaaS health. It is a calculation after expansion gains and offset by contraction and churn. Commonly measured in 12 months.
SaaS Engagement Metrics
Let’s understand some of the top SaaS engagement metrics for your company to grow.
1. Feature Adoption Rate
It shows the number of users highly using a particular feature and tells the product’s depth and resourcefulness. It helps you figure out real value features and spot UX or awareness issues in case of low usage.
2. Upsell & Cross-sell Rates
Upsell rates tell you about how many people moved to better/upgraded/toptier/premium versions of your product/services they chose before. That is, they started paying more than before.
Cross-sell is offering complementary or additional services or products along with the current plan. It is most adopted by multiproduct SaaS environments. Companies generally offer other services that are well integrated with the services they are offering.
3. Expansion Revenues
It is an indicator of growth from existing customers with their increased use of your services. Expansion Revenues can be achieved through upsell, cross-sell, or add-ons. It is a big metric in the scalability of SaaS business growth. For example, if a customer switches from an $8 plan to a $90 plan, or a client increases seats or requirements for the services.
SaaS Customer Satisfaction Metrics
These metrics tell you about the experience your customers are having with your brand. Tracking these metrics will help you understand what needs to be improved, what the demands of your consumers are, and what is dissatisfactory to them.
1. Net Promoter Score (NPS)
One of the most important factors in comprehending customer satisfaction is how likely your customers are to recommend your products and services to others. It is an organic growth element that tells about brand loyalty and customer-brand relationships.
2. Customer Satisfaction Score (CSAT)
It talks about customer satisfaction post-interaction with SaaS services or products. It is a simple parameter that tells whether your product is meeting their expectations or not. Higher CSAT is crucial for long-term growth and customer loyalty. You must wisely use feedback loops, streamline onboarding processes, and fix repetitive utility issues.
3. Customer Effort Score (CES)
This score tells how easily it is for users to use your product and resolve their issues. The more effortless the services are, the higher the chances of customer satisfaction and retention, and it also improves brand loyalty.
4. Health Score of Customers
It is a comprehensive look at the account health of your consumer; it is a combination of usage, engagement, and support signals that forecast customer satisfaction and churn risk.
What is the Importance of SaaS Metrics?
We already saw that there is a plethora of metrics and KPI in Software as a Service businesses, and each talks about a different aspect of business. Therefore, if you wish to succeed in this data-driven and highly technical domain, you must be aware of what & why you did, what & why it went wrong, and what & why it needs to be done. And to answer these questions, tracking the information (i.e., metrics) from various channels of your company is crucial.
Conclusion
A B2B SaaS company faced several challenges in overall growth, and what helped them to fight this was tracking their falling SaaS key metrics and implementing strategies to improve them. A monthly churn rate of 6%, which is higher than the industry average, was reduced to 3.5% in six months. And many other worrisome factors were solved along with this. Different metrics tell you about different angles of improvement in business. We have listed every important metric with a proper categorization for your convenience. Keeping track of your metrics is paramount and can save you from Herculean efforts in one go.
Also Read: How To Master SaaS Sales Strategy? Step-By-Step Guide